

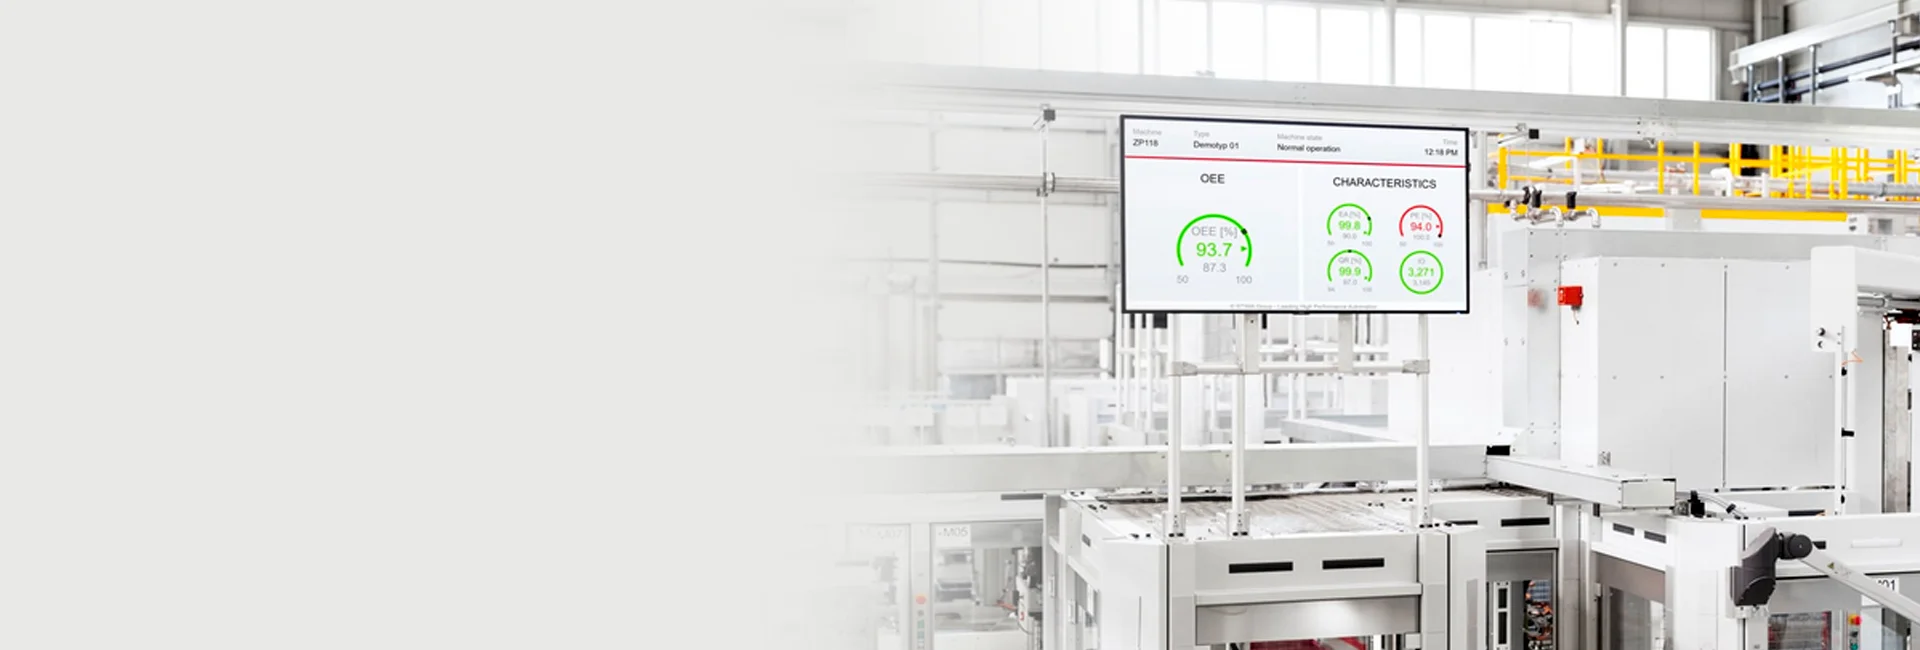
Unify data across disparate sources such as time series, documents, transactions and events to make meaningful use of it as information and knowledge.
Full Business View Across Your Operation


-
ELIMINATE DATA SILOS
Unify disparate and distributed data sources
-
EMPOWER OPTIMIZATION DECISIONS
Unburden executives and supervisors with a more complete data
-
ACTIVATE OPERATIONAL ACTIONS
Activate other departments with operations information

Unlock the Combined Value of IT & OT Data
Create trusted unified views of data across multiple departments.
Read the Solution BriefPentaho Platform Capabilities for Unified IT-OT Integration

“Pentaho Business Analytics allows us to expand the analytics capabilities of our solution and substantially improve the user experience.”
Martin Schwarzenberger
Team Leader, Development Software-Products (Analysis), STIWA Group.

“Connecting to our ERP and IT Systems is a big plus, allowing us to efficiently manage KPIs.”
Benjamin Weller
Controller, Hainbuch Workholding Technology.
“To extract hundreds of millions of data flows and transform them, you have to do a lot of work. Pentaho makes it easier.”
Dan Hopkinson
Head of Network and EMI Services.

What is Data Integration for analytics?
It is the process of combining data from different applications, in different data formats, from multiple locations, to enable users and systems to more easily identify correlations and gain a fuller view of business or operational performance.
Explore All Frequently Asked QuestionsPEOPLE ALSO ASKED
Allows enterprises to combine data from different applications, in different formats, from different locations to enable analysts and data scientists to more easily identify correlations and insights to gain a better view of operational performance.
Is software that is primarily used and governed by IT professionals. It allows data from different applications, in different formats, and multiple locations to be collected, sorted and transformed so that it can be applied to various outcomes.
A data flow diagram (DFD) is a way of representing how data flows through a process or system. It includes data inputs and outputs, data stores, and the various subprocesses the data moves through.


